Arizona Diamondbacks Foundation Snapshot
First entry in a series that looks at each MLB foundation, how they rank along various metrics relative to each other, and highlights their top areas of impact.
The IMPACT+ model views the Arizona Diamondbacks Foundation very favorably. While their high score is in part reflective of being a mid-market team, they can confidently claim that they give away as much, if not more, in total dollars than teams with significantly higher valuations and/or revenues.
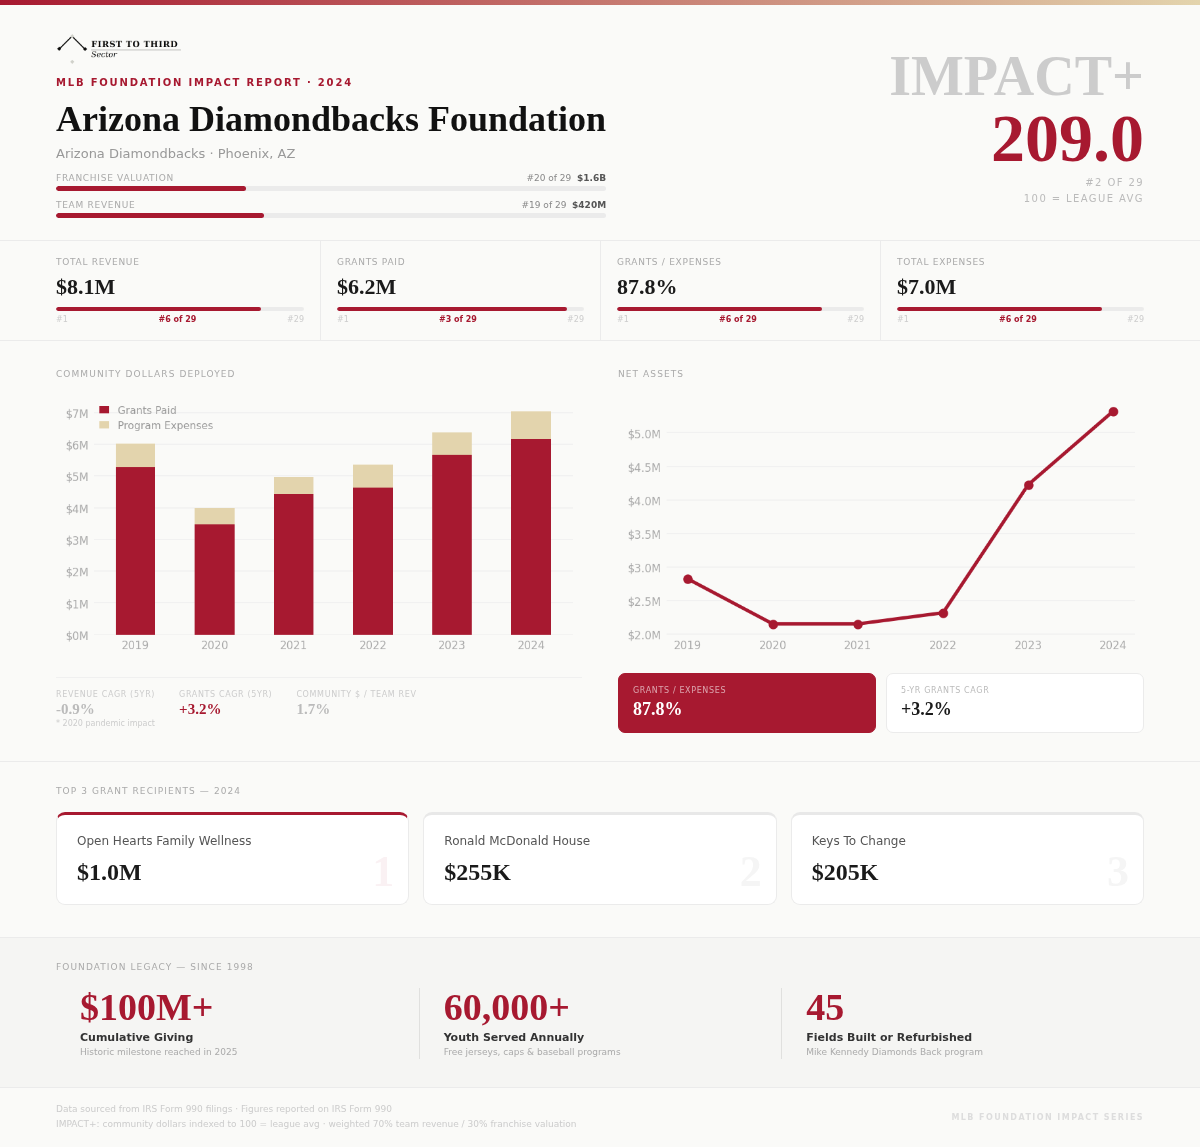
It will be interesting to see if other teams' foundations saw similar dips during the 2020 reporting year given the pandemic and the shortened season. My hypothesis is that fewer games meant less revenue for teams as there were fewer opportunities to raise money via 50/50 raffles and other in-game sponsorships ($100 given for every strikeout, $1,000 for every home run, etc). Some teams appear to report on how much is raised through these opportunities, but I need to do more research to see if I can gather data for all teams. The Foundation's activities are now above where they were before the pandemic.
Earlier this season, the Foundation celebrated $100 million in giving. Interestingly, this article notes that they raised $13.2M in the prior year, so I'll be interested to dive into the 2025 990 once it's available. Though it appears the Foundation is already on its way to increasing the amount of money they give away as they announced in April over $1M in gifts to six Arizona non-profits.
They also publish a very detailed annual report (https://www.mlb.com/dbacks/community), and it will be interesting to see how other teams compare.
Have thoughts or feedback on the graphic, data, or my analysis? Leave a comment or reach out!